
Multi Modality Tumor Tracking streamline workflow for follow-up of oncology patients
The multi-modality post-processing application is used to display, process, analyze, and quantify anatomical and functional images at one or multiple time points.
Manage different cases with one central solution
Cancer patients require constant vigilance. IntelliSpace Portal provides advanced visualization oncology tools to help you evaluate the stage and treatment response at multiple time points – and efficiently perform essential follow‑ups.
Advanced 3D and graphical tools help you store, present, and communicate clinical information to support diagnostic confidence and productive collaboration.
- Body Perfusion
-
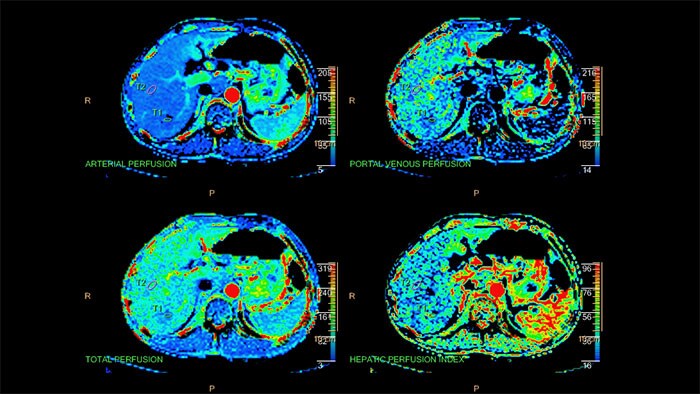
CT Body Perfusion
Quantifiable perfusion
CT Body Perfusion is intended for visualization, assessment and quantification of blood flow, blood volume, time to peak and peak enhancement using dynamic CT data. The application provides whole-organ or single-location liver, lung and kidney perfusion calculations.
Benefits
- Enables data analysis for optimization of injection timing as test prior to the clinical scan.
- Liver Analysis
-
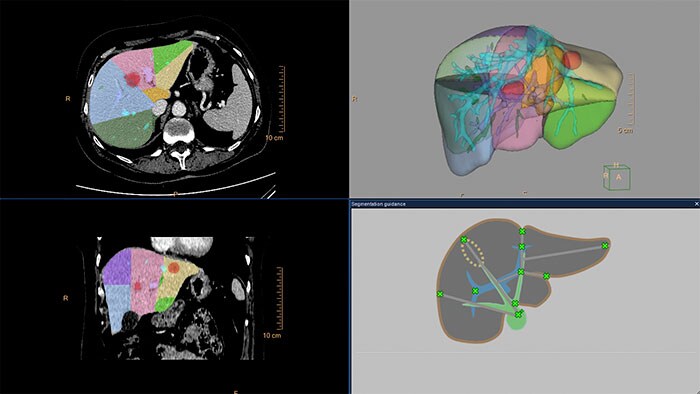
CT Liver Analysis
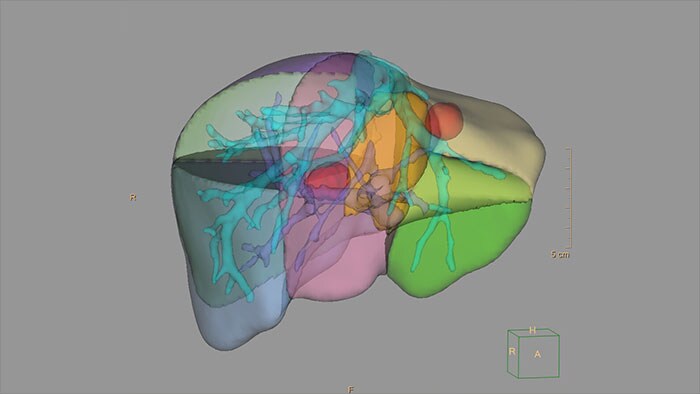
Advanced Liver segmentation
Automatically identifies, segments and quantifies the liver from the portal venous phase of a tri-phase liver scan and classifies the hepatic and portal veins.
Benefits
- Semi-automatic segmentation methods to segment the liver (i.e. Couinaud) and provides tools to analyze and quantify the whole liver, liver segments and user-defined regions of interest.
- Enables virtual hepatectomy, providing volumetric estimates of resected and residual liver segments.
- Results from CT Liver Analysis can be loaded into MMTT and vice-versa.
- Segmentations of the whole liver, liver segments, vasculature and findings can be exported as RT Structures.
- Lung Nodule Assessment (LNA)
-
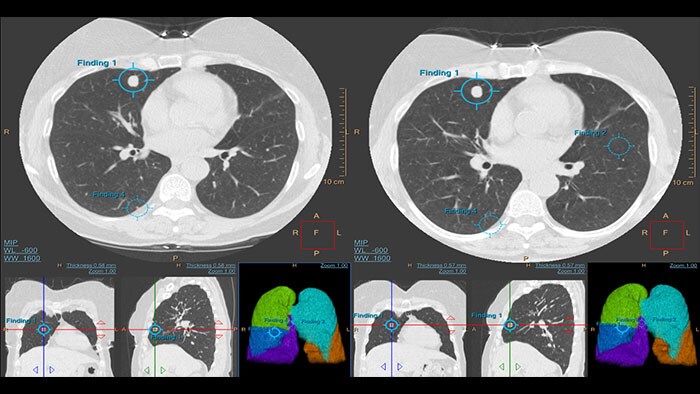
CT Lung Nodule Assessment (LNA)
Assessing lung nodules over time
Enables review and analysis of thoracic CT images, providing segmentation, quantification and characterization of physician-indicated lung nodules. The application can be used in both diagnostic and screening evaluations, supporting Low Dose CT Lung Cancer Screening*
Benefits
- Automatic lung and lobes segmentation and one click 2D and 3D nodule segmentation.
- Supports LungRADS categorization, Fleischner Society guidelines for incidental findings as well as a Risk Calculator tool**.
- Pre-filled data including characteristics for each nodule in configurable presets are provided automatically by the application.
- Lung and nodule segmentations can be shared as RT Structures.
* The screening must be performed within the established inclusion criteria of programs/protocols that have been approved and published by either a governmental body or professional medical society. Please refer to clinical literature, including the results of the National Lung Screening Trial (N Engl J Med 2011; 365:395-409) and subsequent literature, for further information.
** Based on patient and nodule characteristics for estimation of the probability that lung nodules detected on baseline screening low-dose CT scans are malignant. These functionalities may not be available in all territories. Please contact a Philips representative for more details. - Lung Nodule CAD
-
CT Lung Nodule CAD*
Automated computer aid for lung nodule detection
Artificial second reader to support the detection of lesions or nodules which may have been missed. It offers an automated process that identifies and marks regions of interest based on image features associated with lung nodules.
It is intended for use as a second reader after an initial interpretation of the diagnostic image has been performed.
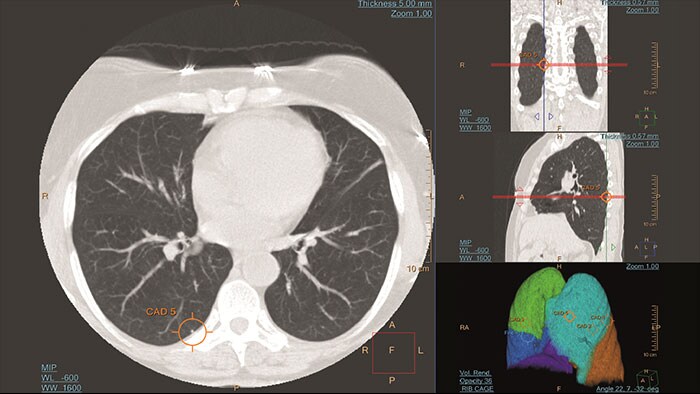
Benefits
- Volumetric segmentation detects nodules based on size, shape, density, and anatomical context.
- One-click display of the findings.
*CAD functionality not available for sale in the US.
- Spectral Light Magic Glass
-
CT Spectral Light Magic Glass
Review spectral data in a range of not spectral-enhanced CT applications
Allows retrospective use of spectral data that was saved in a series of spectral base images (SBI).
The fast launch of LMG allows review and identification of the most relevant results to be launched into the application for further analysis.
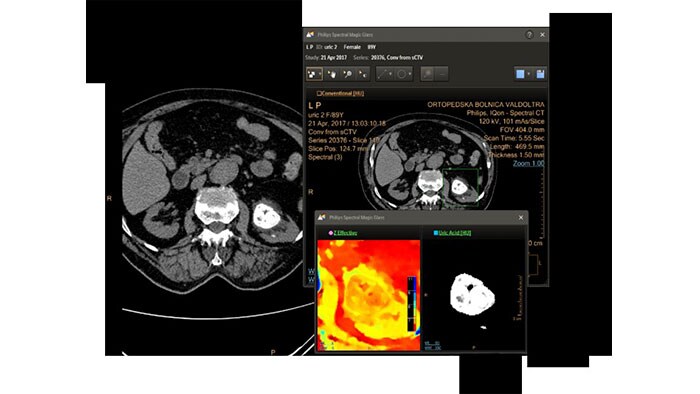
Benefits
- The option is available from the following applications: Brain Perfusion, Functional CT, Liver Analysis, PAA, TAVI, Acute Multifunctional Review, Virtual Colonoscopy.
- Spectral Magic Glass can be launched only for CT images or images created on the Philips IQon Spectral CT.
- Spectral Tumor Tracking
-
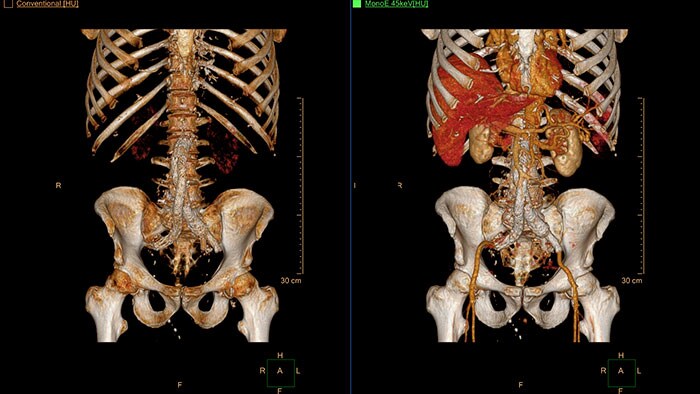
CT Spectral Tumor Tracking
Inspection of tumors, as contrast enhanced, soft tissue oriented, and whole-body scans
Assists clinicians in viewing and evaluating CT images acquired on the IQon CT scanner for the inspection of tumors, as contrast enhanced, soft tissue oriented, and whole-body scans.
It supports lesion viewing and analysis based on different spectral data types such as iodine density maps or virtual non-contrast-enhanced images.
Benefits
- Tissue segmentation and editing tools allow to generate user-defined ROI and the application provides information on physical (length, width, volume) and composition properties (effective atomic number, attenuation, HU) of the tumor.
- The application supports longitudinal viewing of cases taken from different examination times.
- Spectral Viewer
-
CT Spectral Viewer
IQon Spectral CT* Functionality
The spectral viewer is optimized for analysis of spectral data sets from the IQon Spectral CT Scanner. Obtain a comprehensive overview of each patient quickly and easily, quantify quickly, and assist in diagnosis. It is designed to accommodate general spectral viewing needs with additional tools to assist in CT images analysis.
Benefits
- Enhances the conventional image by overlaying an iodine map.
- Visualization of virtual non-contrast images.
- Images at different energy levels (40-200 keV).
- Switching to various spectral results can be done through a viewport control.
- Manage presets to create user/site-specific presets.
- Lesion characterization using scatter plots.
- Tissue characterization using attenuation curves.
* IQon CT reconstruction provides a single DICOM entity containing sufficient information for retrospective analysis - Spectral Base Image (SBI). SBI contains all the spectrum of spectral results with no need for additional reconstruction or post-processing. Spectral applications are creating different spectral results from SBI.
- VC Veralook CAD
-
VC Veralook® CAD*
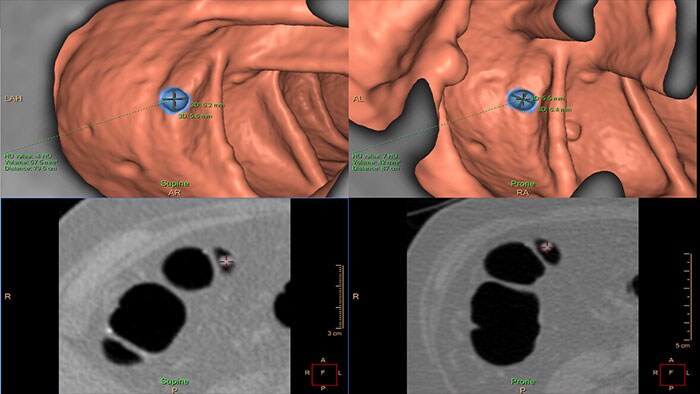
Automatically detect potential polyps in CT colonography exams
VC VeraLook CAD* uses image processing and pattern recognition technology identify colon polyps in CT colonography images, which can help streamline the reading process and improve workflow for radiologists while supporting accuracy, consistency and productivity in colon cancer screenings. Indicated for use as a second read, VeraLook is designed to enhance clinician accuracy and efficiency.
Benefits
- Identify colon polyps to aid in the reading process.
- Designed to enhance clinician accuracy and efficiency by improving detection pedunculated, sessile, flat and fluid submerged colonic polyps.
* VeraLook is a trademark of iCAD inc. for sale only in the US.
- Virtual Colonoscopy
-
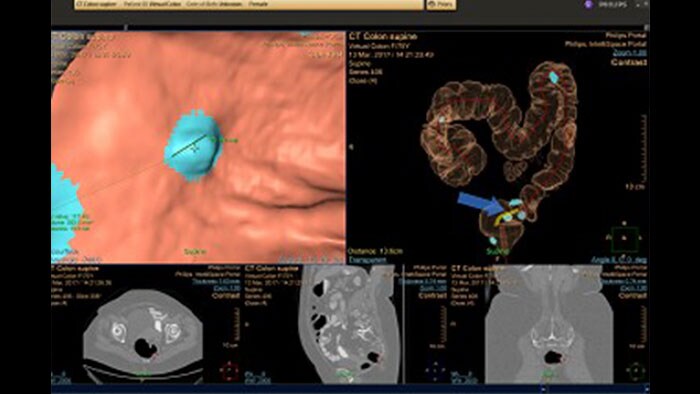
CT Virtual Colonoscopy
Reducing reading times in virtual colonoscopy
Enables 3D visualization of colon scans. The application automatically segments the air-filled colon and displays a calculated navigation path. The Perspective Filet view provides a synchronized display of the full colon surface wall with a single unidirectional view, reducing the need to review in both directions.
Benefits
- The Electronic Cleansing function can reduce the effect of residual liquids and fecal materials by "tagging" them via contrast-enhancement, allowing the user to automatically segment and subtract them.
- The CAD option* can be used as a second reader and assist in the search for polyps.
* CAD functionality is not available for sale in the USA.
- 3D Modeling
-
3D Modeling
Streamlined modeling workflow
Allows to view volumetric images of anatomical structures, perform segmentation, edit and combine segmented elements (tissues) into a 3D model.
Benefits
- Studies of CT & MR can be used for creating a single 3D model of the same patient. The application provides tools that allow the user to align between the volumes of interest in the images.
- 3D Modeling batches files can be easily exported in standard formats such as STL, with the option to also provide a 3D PDF as an additional means for results sharing with 3D printing or other services* .
- The user may determine the information related to the exported elements of the 3D model such as smoothness and output mesh size.
- Contours can also be exported as RT Structures.
*3D models are not intended for diagnostic use.
- Tumor Tracking
-
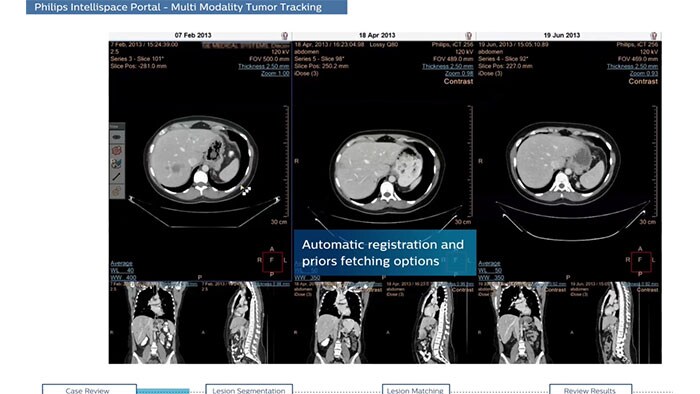
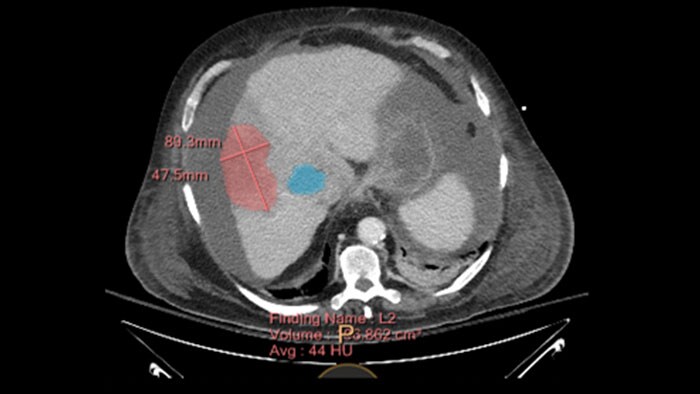
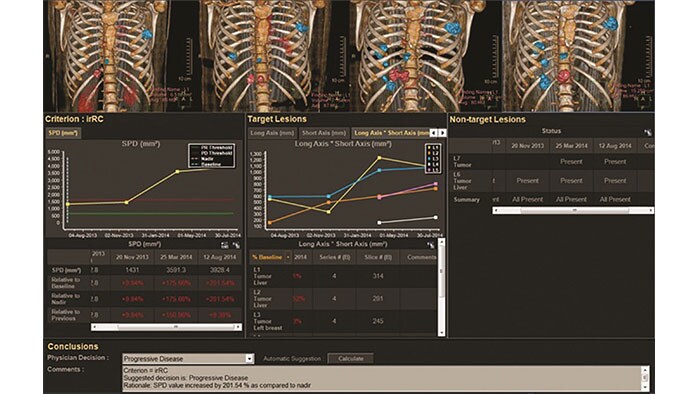
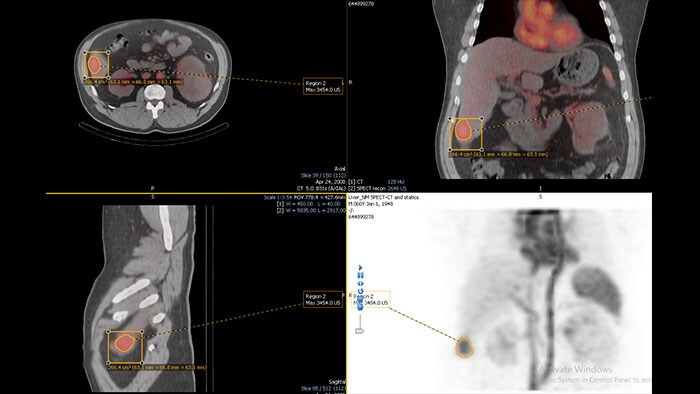
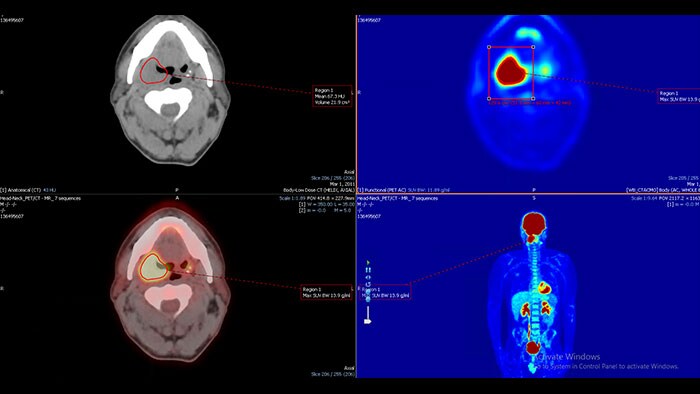
Multi Modality Tumor Tracking (MMTT)
Streamlined workflow for follow up and analysis of oncology patients
MMTT is a post processing software used to display, process, analyze and quantify anatomical and functional images, for CT, MR, PET/CT, SPECT/CT and Dual Energy CT at one or multiple time points.
Benefits
- Enhanced semi-automatic volumetric segmentation.
- Selectable oncology response criteria including standards such as RECIST 1.0, RECIST 1.1, WHO, CHOI, PERCIST, irRC and mRECIST, as well as PET SUV analysis including glucose-corrected SUV.
- Findings can be shared with other IntelliSpace Portal applications such as CT Liver Analysis and CT Viewer or exported in different formats including RT Structures.
- Tumor Tracking qEASL
-
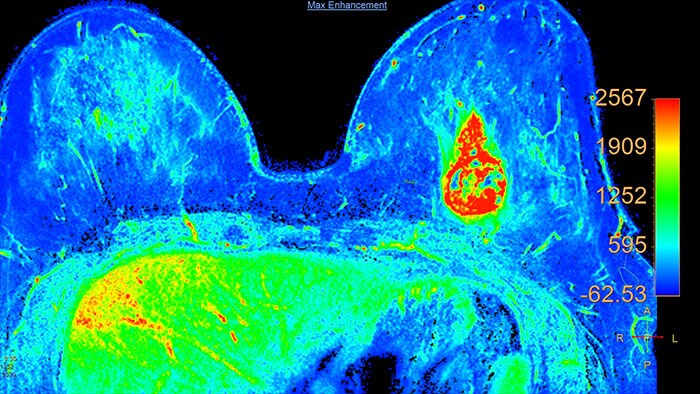
Multi Modality Tumor Tracking qEASL (MMTT qEASL)
Semi-automatic tumor quantification
This semi-automated 3D (Volumetric) tumor response assessment tool, based on EASL (European Association for the Study of the Liver) criteria incorporates functional information from contrast-enhanced scans.
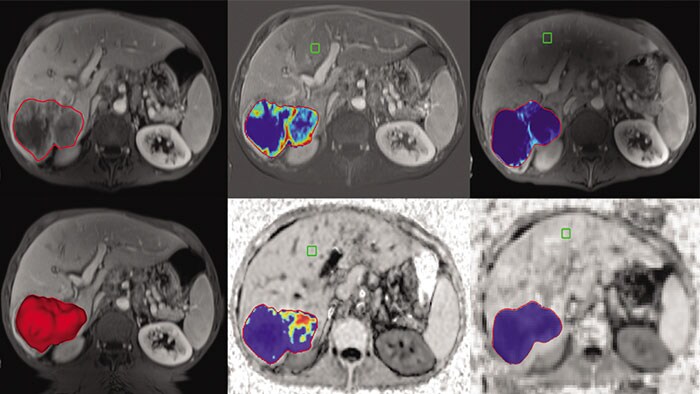
Benefits
- Multi Modality Tumor Tracking supports the creation of Quantitative EASL (qEASL) maps used to measure segmented volumes of interest (VOI) in heterogeneous lesions.
- Data are presented as color map overlaid on the scans to show regional tumor enhancement heterogeneity. The color regions of the segmented lesions are where there is more enhancement than the pre-defined reference region.
- Advanced Diffusion Analysis (ADA)
-
MR Advanced Diffusion Analysis
Computed diffusion weighted images at a b-value of choice
The application is intended to view, process and analyze MRI Diffusion Weighted Images. It calculates and displays cDWI at a
b-value of choice (from 0 to 5,000 s/mm2) and provides advanced supportive analysis and visualization tools of diffusion MRI images and parametric maps.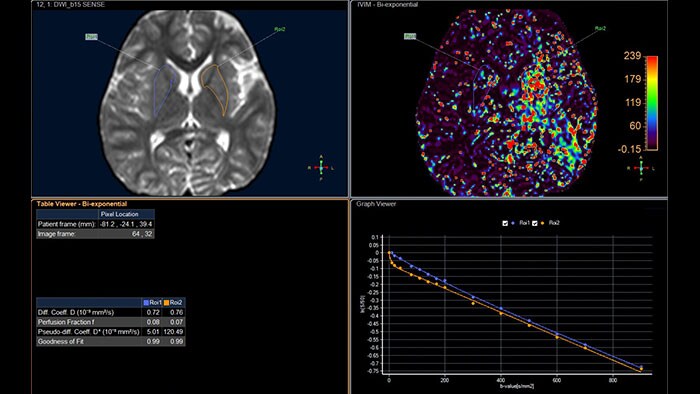
Benefits
- Presents a default diffusion analysis model based on the available original DWI images as well as a selection of alternative models including monoexponential, biexponential, simplified IVIM, and kurtosis.
- A ‘goodness of fit’ value and fitted curve show the fitting quality of the selected model.
- Provides parametric maps of perfusion fraction (f), pseudo diffusivity (D*), Diffusivity (D) and Kurtosis (K).
- DynaCAD Breast
-
MR DynaCAD Breast*
Next generation of breast care
Tailored to enhance the review and analysis of MRI breast studies by providing a flexible workspace with custom hanging protocols and multi-vendor** viewing capabilities. DynaCAD’s automatic segmentation allows on-the-fly user modification and provides volume analysis, lesion composition statistics, histograms, and a 3D rendered morphological overview.
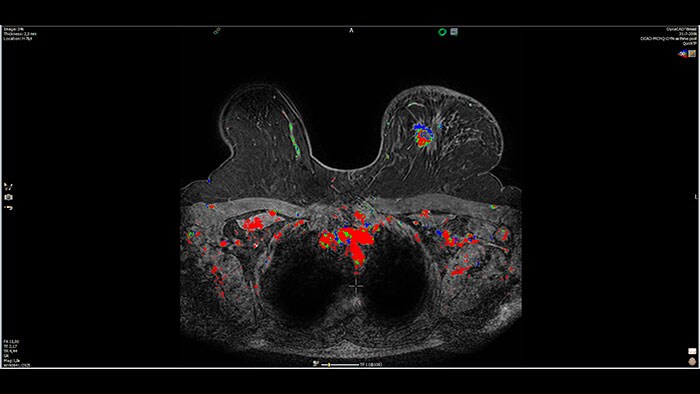
Benefits
- Results are automatically incorporated into standardized reports.
- The DynaLOC Breast Interventional Planning software module offers visual guidance for planning MR-guided breast biopsy procedures.
* Not available for sale in all countries. Please contact local Philips representative for details. This functionality is not available in IX Workstation configuration.
** Please contact a local Philips representative for details on multi-vendor coverage.
DynaCAD is a registered trademark of Invivo Corporation. - DynaCAD Prostate
-
MR DynaCad Prostate*
Advanced prostate image analysis
Provides a powerful, easy-to-navigate, multi-vendor** MR image analysis application featuring custom hanging protocols with images synchronized for easy, multi-parametric review. DynaCAD features automatic segmentation of the prostate gland, providing an overall gland volume estimation.
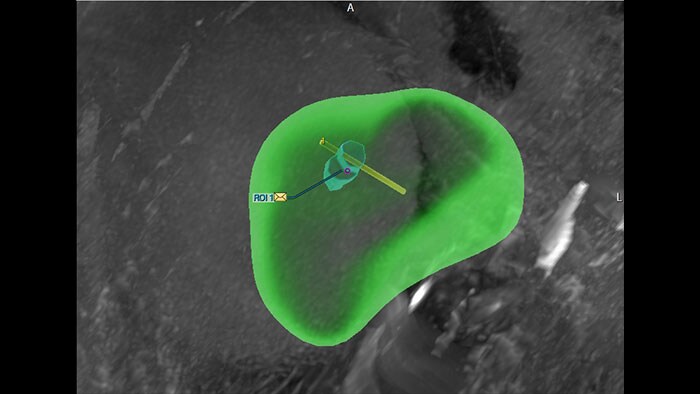
Benefits
- It also features single-click volume analysis, and lesion statistics, and histograms as well as color overlay based on diffusion ADC values.
- Lesions are assessed using the PIRADS v2 scoring and incorporated into standardized reports. Lesions identified and marked on the system can be passed to a UroNav system for MR/Ultrasound fusion biopsy.
* Not available for sale in all countries. Please contact local Philips representative for details. This functionality is not available in IX Workstation configuration.
** Please contact local Philips representative for details on multivendor coverage.
DynaCAD is a registered trademark of Invivo Corporation. - MobiView
-
MR MobiView
Automatic review of total body MR data
MR MobiView, an option within the Multi Modality Viewer, automatically combines "stitches“ images from multiple acquisitions of the same examination to create one overall volume.
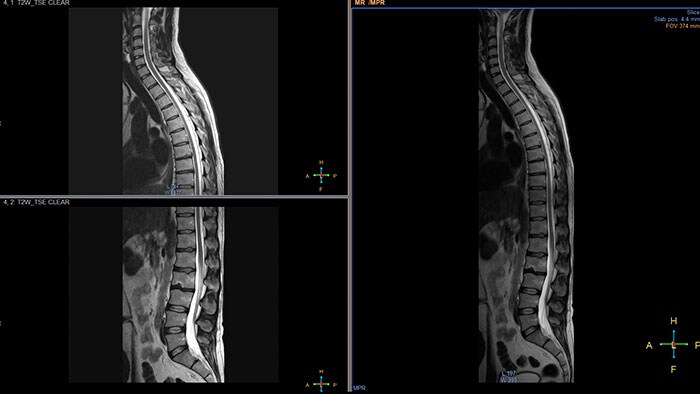
Benefits
- Key clinical cases are MRA run-offs, whole-body metastases screening from eye-to-thigh, and total spine views to show the complete CNS.
- The resulting image series can be viewed, filmed, and exported using a DICOM compliant tool.
- Permeability
-
MR Permeability
Lesion characterization by reviewing vascular leakage
Designed to visualize T1 weighted DCE 3D datasets and assist in analyzing the tissue response.
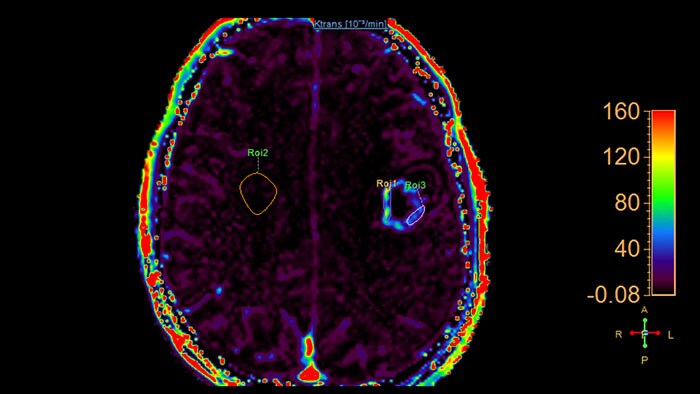
Benefits
- Calculates parametric maps such as Ktrans, Kep, ve and vf.
- The application has been validated for prostate and brain cancer.
- SpectroView
-
MR SpectroView
Review metabolite maps
MR SpectroView is a task-guided application providing hydrogen single voxel spectra as well as metabolic and ratio maps. It automatically identifies the anatomy to preselect appropriate metabolites or supports user-defined combination of metabolites.
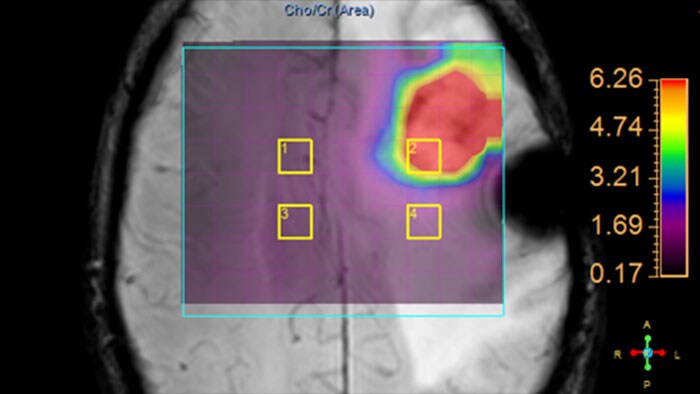
Benefits
- Displays numerical information about metabolites including Peak position and label, SNR, Peak Height, Peak Area, Full Width Half Maximum and Area Ratio of the displayed spectrum.
- Provides metabolite and ratio maps as color overlay on anatomical images or mini spectra on a voxel by voxel basis. Multiple voxels can be selected for spectral comparison.
- Supports automatic and manual phase adjustment as well as a color-coded quality indicator based on field homogeneity and SNR.
- Subtraction
-
MR Subtraction
Perform basic calculations between two volumes
Enables basic calculations between two volumes, including addition, subtraction and ratio from within a single dynamic series.
Benefits
- The application allows to subtract pre-contrast from post-contrast series.
- Weighing factors can be applied to impact the calculation.
- T1 Perfusion
-
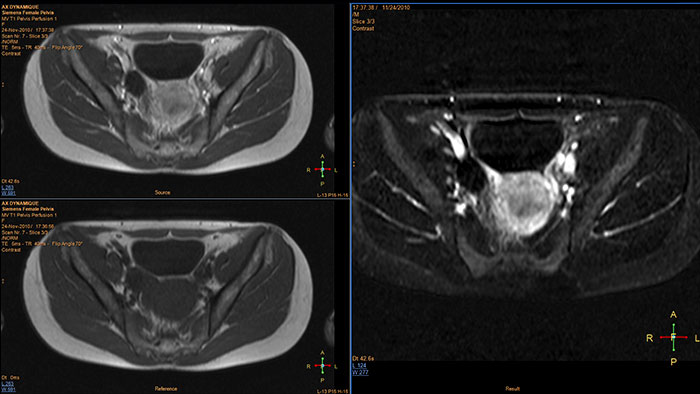
MR T1 Perfusion
Support in assessing lesions by reviewing blood supply characteristics
Designed to evaluate time intensity curves of a T1 signal enhancement series. The application produces measurements including relative enhancement, maximum enhancement, time to peak (TTP), and wash-in/wash-out rates.
Benefits
- The package includes user-selected color-coding of the parametric maps which can be viewed and stored as overlays on anatomical reference images.
- The opacity of the overlay is user-defined.
- The series can be referenced to any other series such as Diffusion data within the same study.
- Mirada NM Viewer: Mirada XD 3.6
-
Mirada NM Viewer: Mirada XD 3.6*
Enhanced user experience for NM reading with a leading NM viewing solution
A comprehensive NM solution, designed to enhance productivity of PET/CT and NM reading. It offers a solution for handling multiple studies requiring rigorous quantification of MV data**.
Benefits
- Quick and configurable protocols for efficient reading.
- Lesion tracking and treatment response.
- Exportable tables and graphs.
- PET\CT and PET\CT\MR registration.
* Mirada is a registered trademark of Mirada inc.
** Please contact local Philips representative for details on multivendor coverage.
- Viewing (in MMV)
-
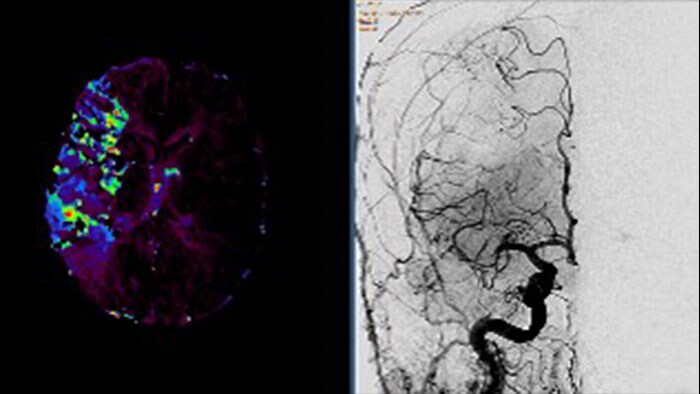
XA Viewing (in MMV)
Comprehensive reviewing tool for multiple modalities, all in a single viewer
The Multi Modality Viewer (MMV) now supports viewing and post processing of angiography images and series. Review and perform analysis of angiographic imaging alongside other modalities for a comprehensive review of the patient case. Perform vascular processing of images (Digital Subtraction Angiography) – subtraction, pixel shifting and land marking. Include key images into the generic MMV report. Prior to the intervention, relevant diagnostic (MR and or CT) data can be bookmarked and automatically retrieved upon patient selection in the Allura, or the Azurion suites.
Benefits
- Enable a comprehensive review of a patient case across all modalities – CT/MR/NM/US/Angio – in a single environment.
- Advance viewing and post-processing (DSA) of angiographic images and series.
- Annotate and perform basic measurements on images (provided the image is pre-calibrated).
- Automatic retrieval of relevant diagnostic (CT and/or MR) data to support the intervention using iBookmark.
- Reporting also supported; key images can be send to an MMV generic report.